Node provider metrics
ICP publishes node metrics publicly and provides an observability stack to collect, inspect, and analyze these metrics. By publishing these metrics worldwide, anyone can monitor the health of ICP nodes, therefore decentralizing the monitoring process, ensuring that more nodes stay healthy, and decreasing the amount of time it takes to resolve any issues. This feature provides increased overall transparency and a more stable network.
The public node metrics feature enables any individual to scrape data about a node's health or metrics using the node's IPv6 address and HTTPS port 42372 at the following URLs:
https://[IPV6]:42372/metrics/hostos_node_exporter: HostOS node exporter metrics.https://[IPV6]:42372/metrics/guestos_node_exporter: GuestOS node exporter metrics.https://[IPV6]:42372/metrics/guestos_replica: GuestOS replica exporter metrics; only available once a node joins a subnet.
Metrics included in these exports include:
Hardware status.
Power consumption.
Networking performance.
The GuestOS version.
Resource utilization.
Additional metrics may be added in the future based on node provider requirements and security reviews.
Manually obtaining metrics
To obtain a node's metrics directly in your web browser, first get the node's IPv6 address from the ICP public dashboard.
For example, node ulyfm-vkxtj-o42dg-e4nam-l4tzf-37wci-ggntw-4ma7y-d267g-ywxi6-iae has an IP address of 2401:7500:1016:0:6801:bbff:fee7:7d39.
Then, change the 5th octet of the IP address from 6801 to 6800 to get the HostOS address:
2401:7500:1016:0:6801:bbff:fee7:7d39 -> 2401:7500:1016:0:6800:bbff:fee7:7d39
Open this IP address in your browser using the following URL format:
https://[2401:7500:1016:0:6800:bbff:fee7:7d39]:42372/metrics/hostos_node_exporter
You will be warned that the certificate is invalid. This is expected, and you can proceed safely.
Your browser window should display node metrics in text format, such as:
# HELP hostos_version HostOS version string
# TYPE hostos_version gauge
hostos_version{version="2e269c77aa2f6b2353ddad6a4ac3d5ddcac196b1"} 1e0
# HELP node_cpu_frequency_max_hertz Maximum cpu thread frequency in hertz.
# TYPE node_cpu_frequency_max_hertz gauge
node_cpu_frequency_max_hertz{cpu="0"} 3.729492e9
node_cpu_frequency_max_hertz{cpu="1"} 3.729492e9
node_cpu_frequency_max_hertz{cpu="10"} 3.729492e9
node_cpu_frequency_max_hertz{cpu="11"} 3.729492e9
node_cpu_frequency_max_hertz{cpu="12"} 3.729492e9
node_cpu_frequency_max_hertz{cpu="13"} 3.729492e9
node_cpu_frequency_max_hertz{cpu="14"} 3.729492e9
node_cpu_frequency_max_hertz{cpu="15"} 3.729492e9
node_cpu_frequency_max_hertz{cpu="16"} 3.729492e9
node_cpu_frequency_max_hertz{cpu="17"} 3.729492e9
node_cpu_frequency_max_hertz{cpu="18"} 3.729492e9
node_cpu_frequency_max_hertz{cpu="19"} 3.729492e9
node_cpu_frequency_max_hertz{cpu="2"} 3.729492e9
...
Using the observability stack
To make these metrics more useful, the IC observability stack has been released alongside the public node metrics feature to provide a way to collect and analyze these metrics. Node providers can use this observability stack to monitor the health of their nodes, operators can detect malfunctions using custom alerts, and any end user can analyze node performance.
This stack is designed to run on a remote machine you control or locally on a VirtualBox virtual machine.
How it works
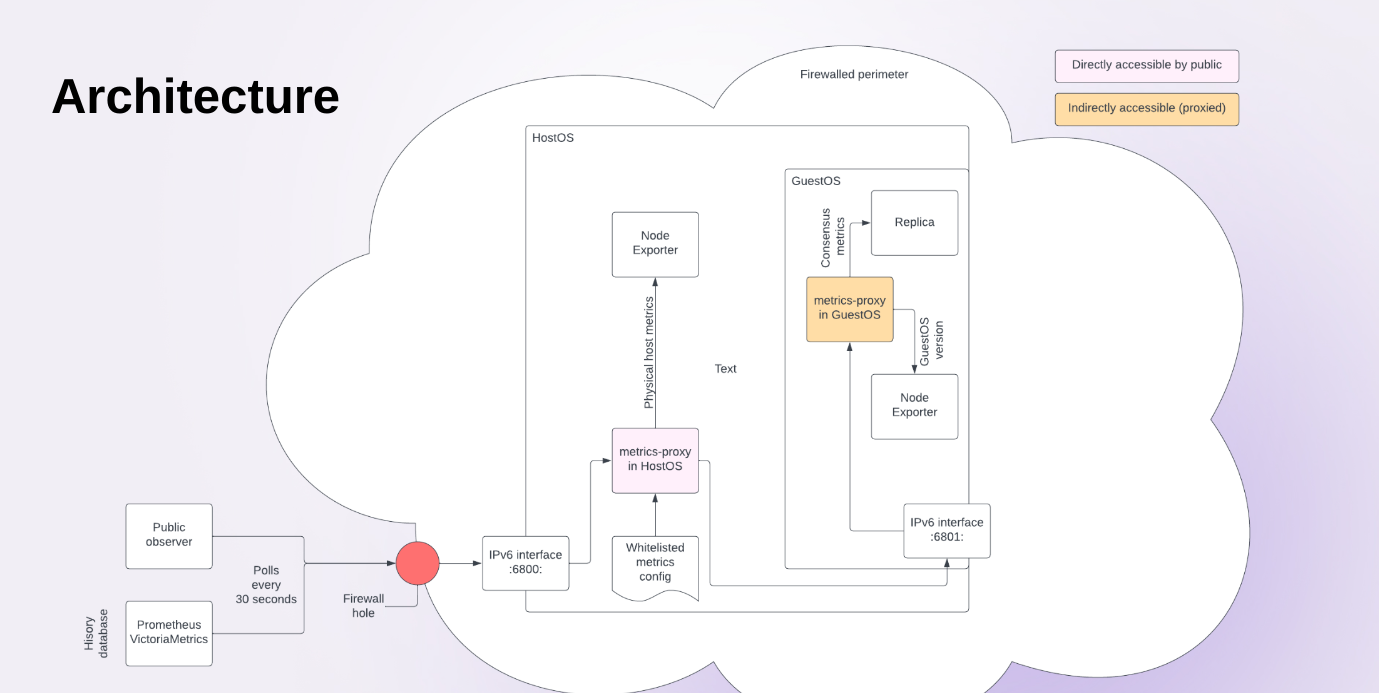
Once the stack is running, it selects nodes and collects metrics from each. The metric data is stored in a local Prometheus database that is updated every few seconds. The database can be queried using a Grafana instance deployed alongside Prometheus.
The following diagram displays the flow of metric information from the node to the observability stack.

Prerequisites
Ensure that you have:
- IPv6 connectivity.
- If you are running the observability stack on a virtual machine, your local network and machine must use IPv6.
- If you are running the observability stack on a remote machine through SSH, the remote machine must have IPV6. Ubuntu LTS or Fedora machines are recommended.
- Root or equivalent access permissions on the host machine.
Setup
Step 1: To setup the observability stack, first clone the
ic-observability-stackonto your local machine:
git clone https://github.com/dfinity/ic-observability-stack.git
If you choose to fork this repo, be sure to make it private to protect key credentials stored within the repo. Consider using a management service compatible with Ansible to secure the credentials.
Step 2: Navigate into the folder through the terminal:
cd /path/to/ic-observability-stack
Step 3: Run
./bootstrap.sh.
You will be required to enter your admin or root password to begin the software setup. Follow the on-screen instructions.
Step 4: Configure where the playbook will execute.
Use the following command to configure where the playbook will run, either in a remote location accessible via SSH or through a virtual machine:
python3 configure.py
Using a virtual machine is the default option, and one will be provisioned with 4 GiB RAM, 50 GiB storage, and a virtual Ubuntu instance.
Step 5: Once provisioned, configure the metrics scrape configuration.
This configuration, stored in the variable scrape_configs will determine which nodes to obtain metric data from. Here is an example:
# Sample scrape configuration
scrape_configs:
  ic_nodes:
    mode: proxied
    nodes:
      # Only monitor this node:
      - 2001:920:401a:1710:6800:f1ff:fe8c:31c2
View additional scrape configuration examples.
Step 6: Once the scrape configuration is set, start the stack with the command:
command -v ansible-playbook || {
  >&2 echo Please set up and export your PATH environment variable so the
  >&2 echo installed ansible-playbook can be found by your shell.  The
  >&2 echo command might have been deployed to "$HOME/.local/bin".
  >&2 echo The next command will fail until PATH is set up properly.
}

ansible-playbook -v playbooks/prepare-node.yml
Whenever you change a setting in your stack, re-run these commands to ensure the changes are applied.
This command can be run multiple times, with only the necessary changes being re-applied each time. Whenever you change the settings of your stack within this repository, you should re-run the command to ensure the settings are applied and take effect.
If you selected virtual machine provisioning in the previous step, the virtual machine will be provisioned, K3s and an instance of Prometheus will be deployed.
If you selected remote machine provisioning, K3s and an instance of Prometheus will be deployed.
Once finished, the observability stack is ready to use. Below are some usage examples.
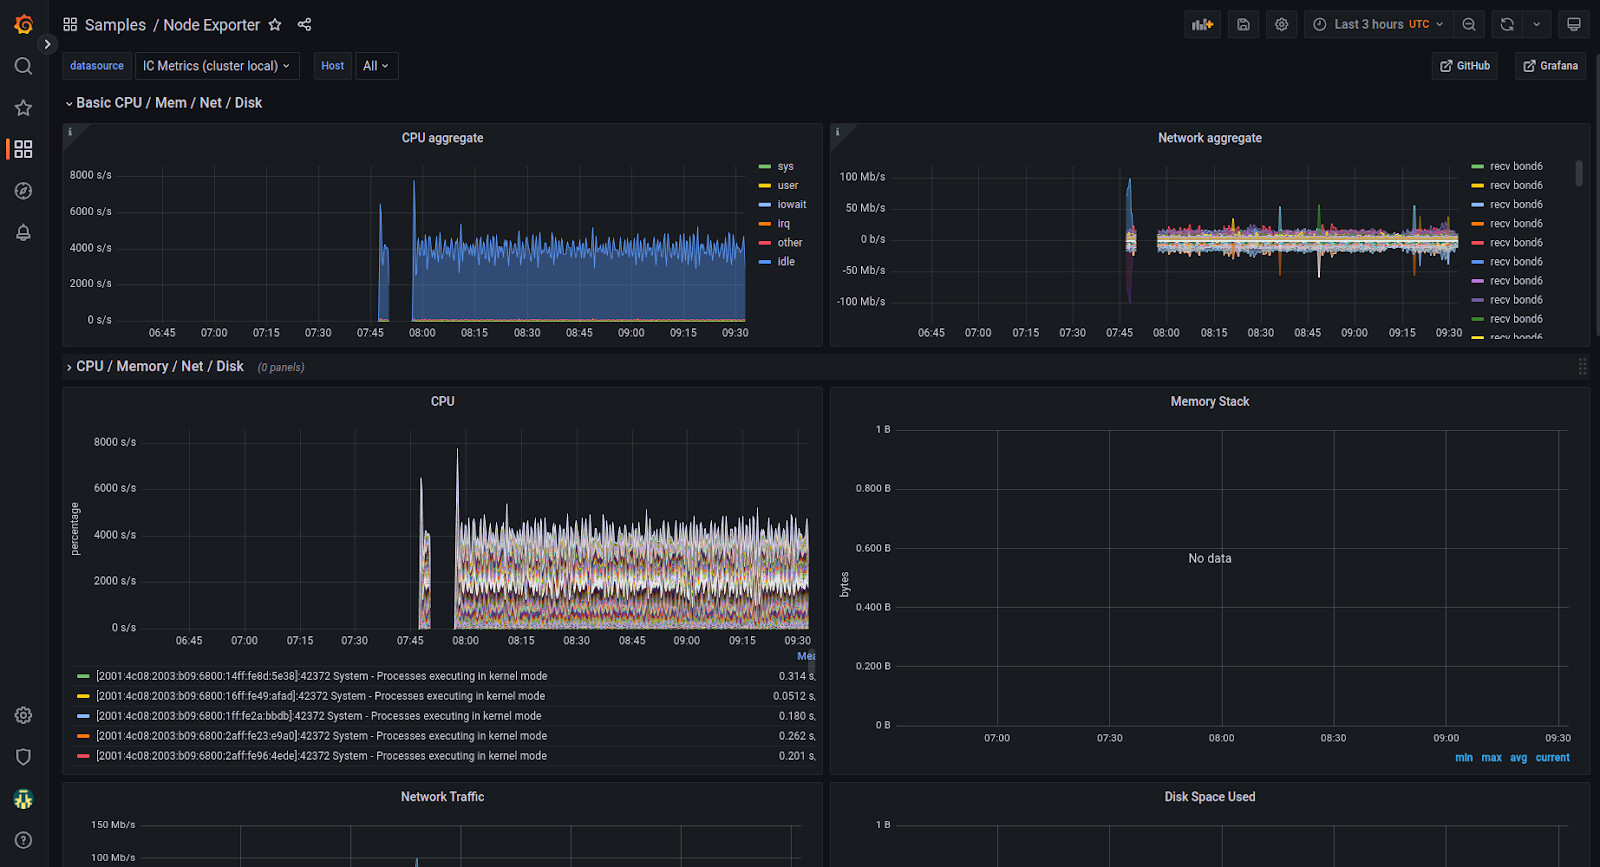
An example of a node exporter dashboard:

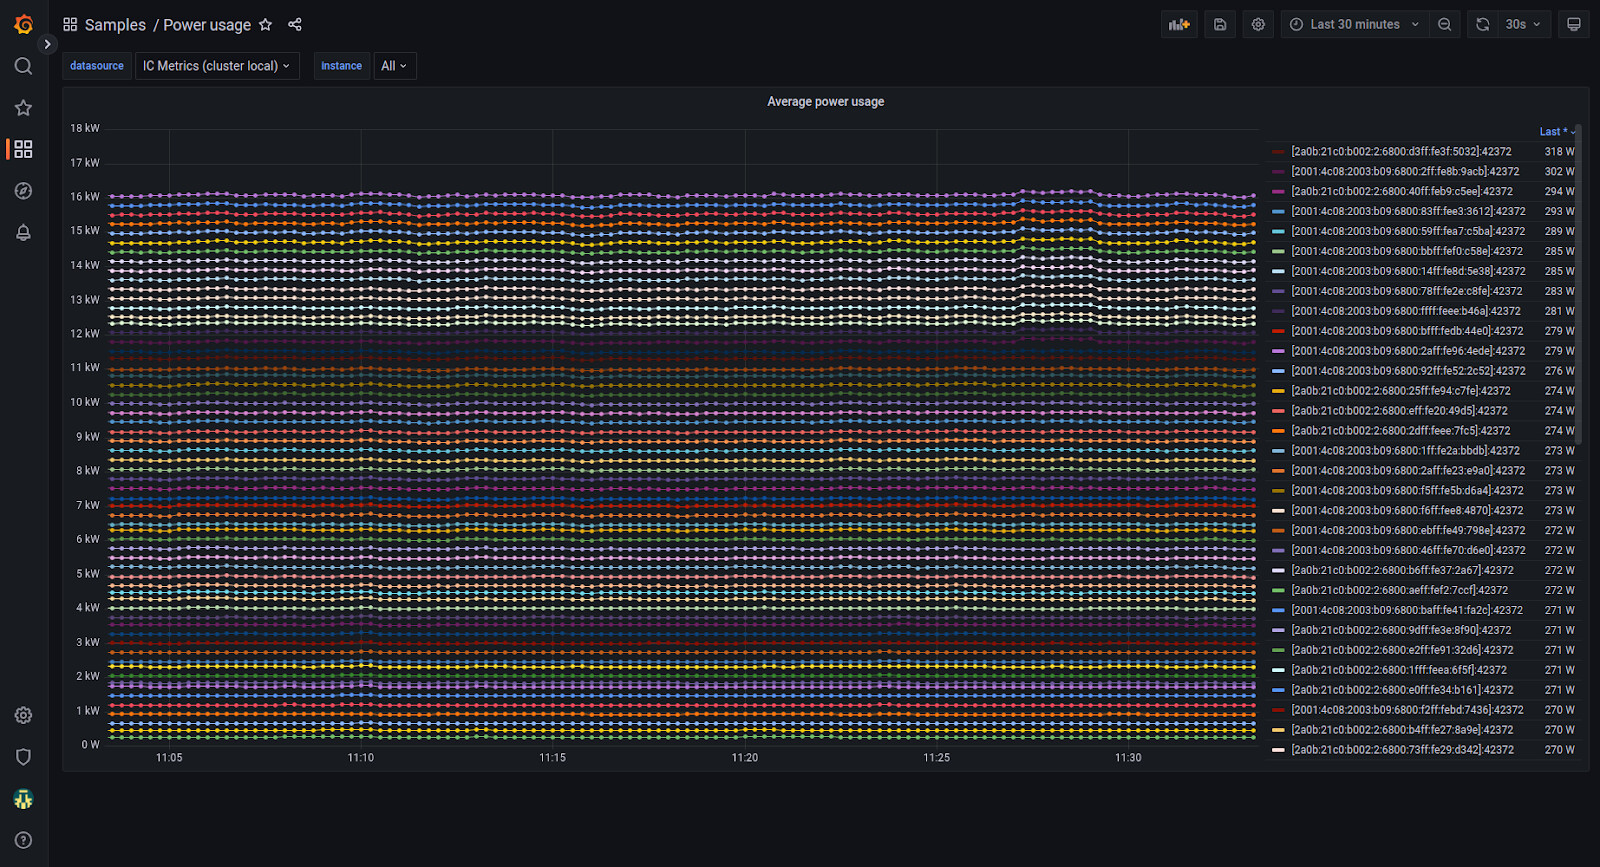
An example of cumulative power usage for all DFINITY nodes:
